
Takako Hashimoto Chiba University of Commerce
The University of Tokyo
Chiba/Tokyo, Japan
takako@cuc.ac.jp
Takeaki Uno National Institute of Informatics
Tokyo, Japan
uno@nii.jp
Yuka Takedomi National Institute of Informatics
Tokyo, Japan
yuka_takedomi@nii.ac.jp
David Shepard Evidation Health
California, USA
hepard.david@gmail.com
Masashi Toyoda Institute of Industrial Science
The University of Tokyo
Tokyo, Japan
toyoda@tkl.iis.u-tokyo.ac.jp
Naoki Yoshinaga Institute of Industrial Science
The University of Tokyo
Tokyo, Japan
ynaga@iis.u-tokyo.ac.jp
Masaru Kitsuregawa National Institute of Informatics
The University of Tokyo
Tokyo, Japan
kitsure@tkl.iis.u-tokyo.ac.jp
Ryota Kobayashi The University of Tokyo
JST PRESTO
Tokyo, Japan
r-koba@edu.k.u-tokyo.ac.jp
Abstract:
In this study, we develop a two-stage clustering method that automatically discovers coarse-grained topics from Twitter data. In the first stage, we use graph clustering to extract micro-clusters from the word co-occurrence graph. All the tweets in a micro-cluster share a fine-grained topic. We then obtain the time series of each micro-cluster by counting the number of tweets posted in a time window. In the second stage, we use time series clustering to identify the clusters corresponding to coarse-grained topics.
We evaluate the computational efficacy of the proposed method and demonstrate its systematic improvement in scalability as the data volume increases. Next, we apply the proposed method to large-scale Twitter data (26 million tweets) about the COVID-19 Vaccination in Japan. The proposed method separately identifies the reactions to news and the reactions to tweets.
keywords–social media analysis, knowledge discovery, graph mining, clustering, time series
Introduction
Twitter is currently one of the most influential microblogging services, allowing users to post and interact with messages known as “tweets.” Twitter stream data contains a plethora of diverse information ranging from personal stories to local and global news and the perceptions of various users. More than 300 million users send over 500 million tweets per day [1], covering a wide range of topics such as their daily activities, news, events, feelings, opinions, etc.It is imperative to grasp the big picture of Twitter through analyzing its huge stream data. While the volume of available data increases rapidly, we cannot read and understand all the tweets manually. Here we aim to develop a method for automatically extracting the main themes or topics from Twitter data. That is, to find all of the topics in the data and assign one to each tweet. Automatic extraction of essential topics from Twitter data has significant applications for the effective use of social media data, such as understanding public perceptions about a disaster (e.g., an earthquake [2,3] and the COVID-19 outbreak [4,5]) for surveillance studies and monitoring public feelings about a product or a company for effective online marketing. In the topic modeling approach [6,7,8], this problem is solved as a classification task in unsupervised machine learning. The topic modeling approach is originally proposed to automatically classify many documents, such as papers and articles for newspapers. In this work, we adopt an alternative approach, that is, using the graph clustering technique [9,10,11] to the word co-occurrence graph constructed from Twitter data. This approach has the advantage of efficiently processing the huge volume of data and utilizing the sparse data (e.g., short messages).
In this study, we present a two-stage clustering method that automatically discovers coarse-grained topics from Twitter data. In the first stage, we apply graph clustering to the word co-occurrence graph and extract micro-clusters corresponding to fine-grained topics of a tweet. We improve Data Polishing algorithm [11,12] to achieve better scalability for data processing. We then obtain the time series of each micro-cluster by counting the number of tweets posted in a time window. Finally, we apply time series clustering in the second stage to find the clusters corresponding to coarse-grained topics.
The proposed method has two advantages. First, this method is highly scalable to work with increased data volume, such that it is suitable for social media big data analysis. Specifically, this property is essential for analyzing Twitter data over a long period. Second, the proposed method utilizes textual and temporal information. Twitter data exhibits highly dynamic activity due to collective human behavior and external news and events. For instance, the time series of tweets exhibits “bursty” activity [13], that is, a sharp rise in the time series. The temporal activity on Twitter associates with the external world events (e.g., earthquake and news) [14,15] and the event types (e.g., sports, election, and file release) [16]. As a result, it is also critical to use temporal information to extract the underlying topics in the Twitter data.
The main contributions of this study are summarized as follows:
- We propose a two-stage clustering method that discovers coarse-grained topics by leveraging textual and temporal information.
- We improve the computational efficiency of Data Polishing algorithm. The proposed method outperforms state-of-the-art methods in scalability, which enables us to analyze 26 million tweets using a laptop.
- We apply the proposed method to the Twitter data about the COVID-19 Vaccination in Japan. The proposed method separately identifies the reactions to news and the reactions to tweets.
Related Work
Recent studies about Twitter data analysis used Latent Dirichlet Allocation (LDA) [6] to identify topics in tweets [4,5]. Although LDA is an effective method for discovering topics, it has several limitations that make it unsuitable for social media data analysis. First, LDA assumes that a document contains several topics, and requires multiple instances of each word to generate meaningful topics, whereas Twitter posts that we consider as documents are too short to repeat any words. Second, to produce effective results, LDA requires several hundred iterations, which makes it inefficient for analyzing millions of documents. Third, social media posts contain large amounts of meaningless messages [17], rumors [18], and misinformation [19]. Finally, another limitation is that it does not consider temporal information, such as tweet timestamps. Several studies has extended the LDA to address one of its shortcomings. For instance, Twitter LDA [7] was proposed to address the short message problem and the dynamic LDA [20] was proposed to take advantage of the temporal information. However, they are subject to the other limitations of LDA as listed above. To address all these issues, we develop a two-stage clustering algorithm that utilizes word and timestamp information. It is also worth noting that, though we used Twitter data in this study, the proposed method applies to any social media data.The graph clustering approach is used in this study to find micro-clusters (i.e., fine-grained topics) in Twitter data. We concentrate on the problem of extracting micro-clusters from a given set of data. A micro-cluster is a group of similar entities (in this case, words) within the data. For our purposes, we want a micro-cluster detection algorithm that has the following characteristics:
- (1)
- quantity: the algorithm should generate proper (tractable) number of micro-clusters;
- (2)
- independence: the micro-clusters are not entirely similar to each other;
- (3)
- coverage: each entity has to belong to a group;
- (4)
- granularity: micro-clusters have homogeneous semantic granularity; and
- (5)
- reproducibility: algorithm must yield the same result in different executions with perturbations of entity order in the data
![\includegraphics[width=17cm]{Fig1_YT.pdf}](/wp-content/uploads/Hashimoto_v1113/img2.svg) |
Real-world event detection from Twitter streams is a hot research topic [23,24]. There are many general event detection methods [25,26] as well as methods for identifying specific classes of events, such as earthquakes [27,28], stock price returns [29], or infectious disease outbreaks [30,31]. However, these works focus on “bursty” events that trigger a sharp rise in the tweet time series about the event [13], whereas we use the similarity of temporal patterns to extract topics. As a result, the proposed method can distinguish the reaction to breaking news from the reaction to tweets.
Another research topic is social media time series analysis. While most studies focus on prediction accuracy [19,32,33], several studies investigated the time seres of collective human attention on the internet and investigated how trending topics attract attention over time [14,15,16]. For instance, Crane and Sornette examined Youtube view activity and identified two patterns [14]: 1) a sudden peak with rapid decay associated with exogenous shocks (e.g., Tsunami) and 2) a gradual increase until the peak followed by symmetric relaxation associated with endogenous effects (e.g., word of mouth effect). While those studies manually analyzed their data, we develops a method for discovering these different classes automatically.
Method for Discovering Coarse-Grained Topics from Twitter
Here we describe the proposed method for discovering coarse-grained topics from large-scale social media data. Fig. 1 depicts conceptually how coarse-grained topics are extracted from the tweets and their timestamps. Suppose that we have a huge volume of Twitter data, with text bodies (tweets) and timestamps, as shown in Fig. 1.A. First, we generate a tweet graph (Fig. 1.B) based on the word co-occurrence between tweets. For example, if two tweets have more than 50% of their words in common, we connect the tweets with an edge. Second, we identify the micro-clusters, that is, the tweets sharing a fine-grained topic, by applying the graph clustering algorithm, an improved Data Polishing algorithm in this case (Fig. 1.C). Third, we obtain the time series of a micro-cluster by calculating the frequency of tweets in a micro-cluster. Finally, by clustering the time series of the micro-clusters, we discover coarse-grained topics (Fig. 1.D). In the following subsections, we explain the main components: graph generation, graph clustering, and time series clustering.
Graph Generation
We generate the tweet graph from Twitter data. The tweet graph is defined as an undirected graph, in which the node represents a tweet and the edge represents the similarity between the tweets. A pair of tweets are connected by the edge if the Jaccard similarity coefficient [34] of the tweets is larger than the threshold .
.
![\includegraphics[width=9cm]{Fig2_YT.pdf}](/wp-content/uploads/Hashimoto_v1113/img4.svg)
Graph Clustering
We identify fine-grained topics by clustering the tweet graph to find micro-clusters (i.e., dense subgraphs) (Fig. 2). It is expected that all the tweets in a micro-cluster have a quite similar meaning. Here, we use an improved Data Polishing algorithm to find micro-clusters. Data Polishing [11] transforms our tweet graph into a graph whose dense subgraphs are all cliques. This algorithm iteratively adds an edge between two nodes that are likely to belong to the same cluster and deletes an edge between two nodes unlikely to belong to the same cluster. Specifically, we add an edge between nodes ( ,
,  ) if the Jaccard similarity coefficient of the neighbor sets (
![$N[u]$](/wp-content/uploads/Hashimoto_v1113/img7.svg) ,
, ![$N[v]$](/wp-content/uploads/Hashimoto_v1113/img8.svg) ) is larger than the threshold
) is larger than the threshold
 .
We delete any existing edges that do not satisfy this threshold.
Data Polishing iterates this operation until convergence, and the graph is composed of a proper number of cliques corresponding to some topics.
Finally, maximal clique enumeration is performed by using MACE [35] to obtain the micro-clusters.
.
We delete any existing edges that do not satisfy this threshold.
Data Polishing iterates this operation until convergence, and the graph is composed of a proper number of cliques corresponding to some topics.
Finally, maximal clique enumeration is performed by using MACE [35] to obtain the micro-clusters.
In this paper, we have improved the computational efficiency of Data Polishing. The most time consuming part is the computation of the Jaccard similarity coefficient. The main idea to improve the efficiency is to unify the isomorphic nodes, whose neighbor sets are the same, into a single node. In addition, the tweets (nodes) that share the same bag-of-words were unified into a node. Due to retweets, there are many tweets of the same bag-of-words. We can expect these modifications accelerate Data Polishing in large-scale tweet data.
Time Series Clustering
Although we can identify the topics by using the improved Data Polishing algorithm, it often generates too many topics to analyze manually or to interpret the data. Thus, we leverage the timestamps of tweets to obtain coarse-grained topics that are easy to interpret for a human.
First we obtain the time series of a micro-cluster by dividing 30 minute time windows and counting the number of tweets in the micro-cluster posted in a time window. We then apply time series clustering, specifically K-Spectral Centroid (K-SC) [36] clustering, to obtain the cluster of micro-clusters that exhibit a similar temporal pattern (Fig. 3). We adopted K-SC algorithm because it robustly captures clusters by using a similarity metric invariant to scaling and shifting, and it also efficiently finds the clusters for large data sets.
The K-SC algorithm is an extension of the k-means algorithm and it finds the cluster centroid of the time series  by minimizing the objective function:

 is the number of clusters,
  is the
  -th time series, and
  is a set that represents the member of the
  -th cluster.
The K-SC’s distance metric
-th cluster.
The K-SC’s distance metric
 between the two time series (
 and
and  ) is defined as follows:

 is the result of shifting time series by
  time units, and
  represent the
  norm.
norm.
![\includegraphics[width=9cm]{Fig3_YT.pdf}](/wp-content/uploads/Hashimoto_v1113/img25.svg)
Runtime Experiment
The proposed method consists of two clusterings: graph clustering and time series clustering. The first stage (graph clustering) is a potential bottleneck of computation when we process huge data volumes. In this section, we evaluate the scalability of the computation time of the graph clustering to the increase in the number of tweets. We first describe the Twitter data set and experimental setup. Then we examine the runtime to process the Twitter data and compare the proposed algorithm to the state-of-the-art algorithms.
Setup
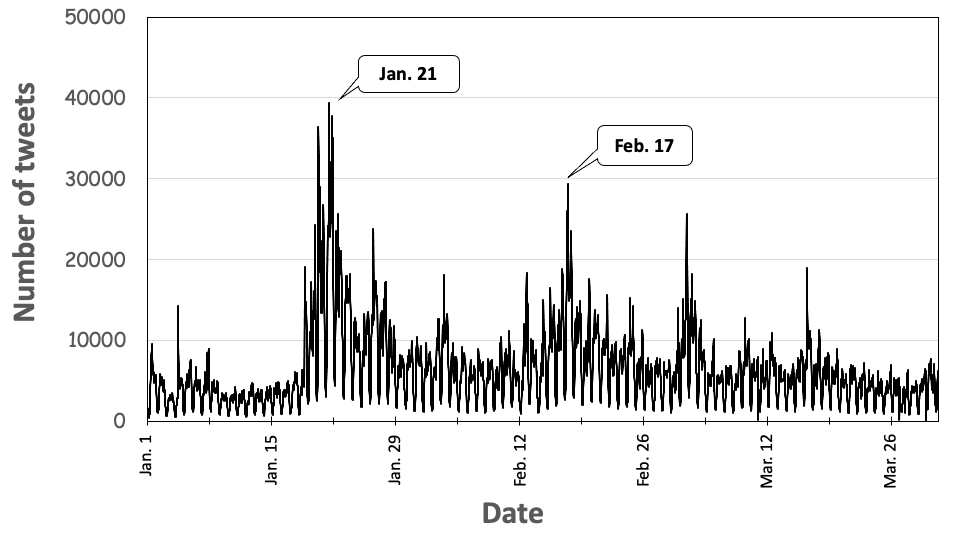
Our data consists of all the Japanese tweets including the word “waku-cine” (vaccine in Japanese) posted during Jan. 1, 2021 and Mar. 31, 2021. This data set was provided by NTT DATA Corporation. This data set consists of 26,359,783 tweets, which offers a substantial corpus for analyzing the perception of the COVID-19 vaccination in Japan. Fig. 4 shows the time series of the tweets, that is, the number of tweets in a time window of 30 minutes. There are major peaks around January 21 and February 17. The second peak likely due to the news and tweets that Japan started the first COVID-19 vaccinations to health workers in Tokyo [37].
First we segment each tweet into words using the Japanese morphological analyzer MeCab [38] and removed stop words,
such as “kore” (this in Japanese), “sore” (it in Japanese), and “suru” (do in Japanese).
Then, we generate the tweet graph whose node corresponds to a tweet.
A pair of tweets was connected with an edge, if the Jaccard similarity coefficient of the word set between the two tweets is more than the threshold
 . Roughly speaking, we assign the edge between two tweets when the both tweets have more than 50% of words in common.
Finally, we used the improved Data Polishing to find micro-clusters from the tweet graph.
The threshold
was set to 0.2 in this paper.
Our explorations suggest that the results are qualitatively not affected by the choice of
.
. Roughly speaking, we assign the edge between two tweets when the both tweets have more than 50% of words in common.
Finally, we used the improved Data Polishing to find micro-clusters from the tweet graph.
The threshold
was set to 0.2 in this paper.
Our explorations suggest that the results are qualitatively not affected by the choice of
.
 |
Performance of graph clustering algorithm
Here we have improved the computational efficiency of Data Polishing [11]. Based on the data preprocessing and the parameters described in “A. Setup”, we evaluate the performance of our algorithm in term of speed.
We compare the proposed algorithm with five existing algorithms for finding topics from tweets: LDA [6], K-means [39], MeanShift [40], Agglomerative clustering [41], and Data Polishing [11].
LDA is the most popular algorithm based on word frequency in a document.
K-means, MeanShift, and Agglomerative clustering are general clustering algorithm, which are applied to the word vector of each tweet
 , where
  is the number of the -th word in a tweet.
Data Polishing is a Graph clustering algorithm, which was applied to the tweet graph (Fig 1 B).
We used the following implementations: Python Gensim [42] for LDA,
scikit-learn for K-means, MeanShift, and Agglomerative Clustering [43], and
Nysol Python for Data Polishing [44].
All our experiments were performed on a Mac mini (2018), with a 3.2 GHz Intel Core i7 with 64GB 2667 MHz of memory.
is the number of the -th word in a tweet.
Data Polishing is a Graph clustering algorithm, which was applied to the tweet graph (Fig 1 B).
We used the following implementations: Python Gensim [42] for LDA,
scikit-learn for K-means, MeanShift, and Agglomerative Clustering [43], and
Nysol Python for Data Polishing [44].
All our experiments were performed on a Mac mini (2018), with a 3.2 GHz Intel Core i7 with 64GB 2667 MHz of memory.
Figure 5 shows the runtime of the algorithms, when the number of tweets was increased from 1,000 to 1,000,000. The runtime was evaluated by executing each method three times and calculating the average. The tweets are randomly selected from the data set. Note that we stopped the measurement if the runtime reached 10,000 seconds. While MeanShift, Data Polishing, and the proposed method can automatically determine the number of micro-clusters (topics) from the data, the other methods cannot. For those methods, the number of clusters was assigned as the number of the non-trivial clusters (the clusters whose size is more than two) generated by Data Polishing. Note that the proposed algorithm is an improved Data Polishing which generates the same result as the original algorithm. The result shows that the proposed algorithm is more efficient than the existing algorithms and it takes only 1,600 seconds to find micro-clusters from a million tweets. The second-most efficient algorithm is Data Polishing. It is quite efficient when the number of tweets are less than 100,000. However, the proposed algorithm is 20 times faster than the original one for processing 500,000 tweets. The third most efficient one is the LDA. The proposed algorithm is more than 300 times faster than LDA with a data set of 100,000 tweets. The other algorithms (K-means, MeanShift, and Agglomerative Clustering) cannot process a data set larger than 50,000 tweets in three hours.
![\includegraphics[width=8.5cm]{Runtime.pdf}](/wp-content/uploads/Hashimoto_v1113/img29.svg) |
Case study: Discovering Perceptions about the COVID-19 vaccination in Japan
The proposed method (Fig. 1) is applied to large-scale Twitter data to discover coarse-grained topics of public perceptions. Twitter data in Japanese about the COVID-19 vaccine were analyzed as a case study to examine the feasibility of the application to surveillance studies.
After finding micro-clusters from the Tweet graph, we extracted coarse-grained topics from the largest top 1,000 micro-clusters (5,857,931 tweets) using time-series clustering (Sec. III C).
The K-SC algorithm was adopted for time series clustering. We used the Matlab code [45] provided by the author of Ref. [36]. The number of clusters is set to 12.
In the following, we describe the clusters obtained by the K-SC algorithm as topics.
Figure 6 shows the cluster center and the word cloud of each topic.
The word cloud is obtained by aggregating all the micro-clusters in a cluster.
We quantified the cluster center time series using the burst score  defined as the ratio of the tweets in a cluster, which were posted within a hour before and after the peak.
![\includegraphics[width=18cm]{Fig6_YT.pdf}](/wp-content/uploads/Hashimoto_v1113/img30.svg) |
We manually identify the events, news, and tweets associated with the topic by searching Twitter based on the frequent words and the peak date. Observations of each topic are as follows: Topic 1 represents the breaking news that Pfizer’s vaccine was officially approved by the Ministry of Health, Labour, and Welfare (MHLW) (Feb. 14). Topic 2 represents news that Mr. Kono was appointed as the Minister of Vaccine (Jan. 18). Topic 3 corresponds to a typical information meme. Twitter users started to play on words: they represented getting vaccination twice as “vac-vac-cine-cine” (waku-waku-cine-cine in Japanese). The nuance and funny sound of the word grasped the users’ mind and diffused as a meme. Topic 4 shows the reactions to the internet articles and columns related to the immunization schedule and the reluctance to take the vaccine. Topic 5 represents anxieties and skeptical views of people against the effectiveness of the vaccine. A tweet of the Prime Minister’s office was retweeted and spread as an information diffusion. Topic 6 represents the side effects of the vaccine. Topic 7 includes rumors about Chinese vaccines. Topic 8 represents the reactions to side effects, and the tweets which dispelled concerns about them seem to diffuse. Topic 9 represents the reactions to the side effects of the vaccine. One of the main issues was about the woman who died of a subarachnoid hemorrhage after the vaccination. Topic 10 represents the reactions to the prior vaccination for doctors and health care workers. Dispelling concerns about vaccines is one of the topics here. Topic 11 represents the reactions to minor news, which includes unverified gossips and doubts about vaccine effectiveness. Topic 12 contains the whisperings that wealthy people skipped the line and had already taken the Chinese vaccine. It also contains the rumors that nursing students could not have declined the vaccination regardless of their own will.
From the observations above, three types of topics are deduced qualitatively:
- A
- Reaction to the news (8%: 448,293 tweets).
- B
- Reaction to the tweets (43%: 2,532,962 tweets).
- C
- Others (rumors, gossips, etc.) (49%: 2,876,676 tweets).
This qualitative categorization is supported by the burst score .
The burst score of type A topics is highest in all the types:

 .
The cluster centers of type C topics do not have prominent peaks.
The burst score of type B topics is between 0.02 and 0.10. These topics exhibit symmetric peaks compared to type A topics, implying the endogenous effect (e.g., word of mouth or information diffusion due to retweets) [14].
.
The cluster centers of type C topics do not have prominent peaks.
The burst score of type B topics is between 0.02 and 0.10. These topics exhibit symmetric peaks compared to type A topics, implying the endogenous effect (e.g., word of mouth or information diffusion due to retweets) [14].
Conclusion
We develop a two-stage clustering method for discovering the topics of people’s perceptions from Twitter (i.e., tweets and its timestamps). First, we generate the Tweet graph based on the word co-occurrence between tweets. In the first stage clustering, we apply graph clustering to the tweet graph and obtain micro-clusters, that is, a group of tweets sharing a fine-grained topic. We then obtain the time series of a micro-cluster by calculating the frequency of tweets in the micro-cluster. Finally, in the second stage clustering, we apply time series clustering to obtain clusters corresponding to coarse-grained topics. We improve the computational efficiency of Data Polishing algorithm to find micro-clusters and evaluate the runtime of the proposed method. Our method outperforms state-of-the-art methods in scalability, which enables us to analyze 26 million tweets using a laptop. Finally, we apply this method to large-scale Twitter data about the COVID-19 Vaccination in Japan. Our method discovers coarse-grained topics that exhibit three types of temporal patterns: A) the reaction to breaking news, B) the reaction to tweets (information diffusion), and C) the others (e.g., rumors, gossips).
Acknowledgment
We thank NTT DATA Corporation for their cooperation to provide Twitter data that we used for the analysis. We also acknowledge Tetsuji Kuboyama and Kilho Shin for fruitful discussions.
This study was partially supported by JSPS KAKENHI Grant Numbers JP18K11443, JP18K11560, JP19H0113, JP21H03559, and JP21H04571, JST CREST Grant Number JPMJCR1401, JST CREST Grant Number JPMJCR19A4, and JST PRESTO Grant Number JPMJPR1925.
Bibliography
- 1
-
David Sayce.
The number of tweets per day in 2020.
https:www.dsayce.comsocial-mediatweets-day. - 2
-
Son Doan, Bao-Khanh Ho Vo, and Nigel Collier.
An analysis of twitter messages in the 2011 tohoku earthquake.
In International conference on electronic healthcare, pages 58–66. Springer, 2011. - 3
-
Yan Wang and John E Taylor.
Coupling sentiment and human mobility in natural disasters: a twitter-based study of the 2014 south napa earthquake.
Natural hazards, 92(2):907–925, 2018. - 4
-
Richard J Medford, Sameh N Saleh, Andrew Sumarsono, Trish M Perl, and
Christoph U Lehmann.
An “infodemic”: leveraging high-volume twitter data to understand early public sentiment for the coronavirus disease 2019 outbreak.
Open Forum Infectious Diseases, 7(7):ofaa258, 2020. - 5
-
Joanne Chen Lyu, Eileen Le Han, and Garving K Luli.
Covid-19 vaccine–related discussion on twitter: Topic modeling and sentiment analysis.
Journal of medical Internet research, 23(6):e24435, 2021. - 6
-
David M Blei, Andrew Y Ng, and Michael I Jordan.
Latent dirichlet allocation.
Journal of machine Learning research, 3(Jan):993–1022, 2003. - 7
-
Wayne Xin Zhao, Jing Jiang, Jianshu Weng, Jing He, Ee-Peng Lim, Hongfei Yan,
and Xiaoming Li.
Comparing twitter and traditional media using topic models.
In European conference on information retrieval, pages 338–349. Springer, 2011. - 8
-
David M Blei.
Probabilistic topic models.
Communications of the ACM, 55(4):77–84, 2012. - 9
-
George Karypis and Vipin Kumar.
Metis: A software package for partitioning unstructured graphs, partitioning meshes, and computing fill-reducing orderings of sparse matrices.
1997. - 10
-
Ravi Kumar, Prabhakar Raghavan, Sridhar Rajagopalan, and Andrew Tomkins.
Trawling the web for emerging cyber-communities.
Computer networks, 31(11-16):1481–1493, 1999. - 11
-
Takeaki Uno, Hiroki Maegawa, Takanobu Nakahara, Yukinobu Hamuro, Ryo Yoshinaka,
and Makoto Tatsuta.
Micro-clustering by data polishing.
In 2017 IEEE International Conference on Big Data (Big Data), pages 1012–1018. IEEE, 2017. - 12
-
Takako Hashimoto, David Lawrence Shepard, Tetsuji Kuboyama, Kilho Shin, Ryota
Kobayashi, and Takeaki Uno.
Analyzing temporal patterns of topic diversity using graph clustering.
The Journal of Supercomputing, 77(5):4375–4388, 2021. - 13
-
Jon Kleinberg.
Bursty and hierarchical structure in streams.
Data mining and knowledge discovery, 7(4):373–397, 2003. - 14
-
Riley Crane and Didier Sornette.
Robust dynamic classes revealed by measuring the response function of a social system.
Proceedings of the National Academy of Sciences, 105(41):15649–15653, 2008. - 15
-
Janette Lehmann, Bruno Gonçalves, José J Ramasco, and Ciro Cattuto.
Dynamical classes of collective attention in twitter.
In Proceedings of the 21st international conference on World Wide Web, pages 251–260, 2012. - 16
-
Ryota Kobayashi, Patrick Gildersleve, Takeaki Uno, and Renaud Lambiotte.
Modeling collective anticipation and response on wikipedia.
Proceedings of the International AAAI Conference on Web and Social Media, 15(1):315–326, 2021. - 17
-
Jonathan Hurlock and Max L Wilson.
Searching twitter: Separating the tweet from the chaff.
In Fifth International AAAI Conference on Weblogs and Social Media, pages 161–168, 2011. - 18
-
Carlos Castillo, Marcelo Mendoza, and Barbara Poblete.
Information credibility on twitter.
In Proceedings of the 20th international conference on World wide web, pages 675–684, 2011. - 19
-
Taichi Murayama, Shoko Wakamiya, Eiji Aramaki, and Ryota Kobayashi.
Modeling the spread of fake news on twitter.
Plos one, 16(4):e0250419, 2021. - 20
-
David M Blei and John D Lafferty.
Dynamic topic models.
In Proceedings of the 23rd international conference on Machine learning, pages 113–120, 2006. - 21
-
Takeaki Uno, Masashi Kiyomi, Hiroki Arimura, et al.
Lcm ver. 2: Efficient mining algorithms for frequent/closed/maximal itemsets.
In Fimi, volume 126, 2004. - 22
-
Martin Ester, Hans-Peter Kriegel, Jörg Sander, Xiaowei Xu, et al.
A density-based algorithm for discovering clusters in large spatial databases with noise.
In kdd, volume 96, pages 226–231, 1996. - 23
-
Farzindar Atefeh and Wael Khreich.
A survey of techniques for event detection in twitter.
Computational Intelligence, 31(1):132–164, 2015. - 24
-
Mahmud Hasan, Mehmet A Orgun, and Rolf Schwitter.
A survey on real-time event detection from the twitter data stream.
Journal of Information Science, 44(4):443–463, 2018. - 25
-
Jianshu Weng and Bu-Sung Lee.
Event detection in twitter.
In Proceedings of the International AAAI Conference on Web and Social Media, volume 5, pages 401–408, 2011. - 26
-
Carmela Comito, Agostino Forestiero, and Clara Pizzuti.
Bursty event detection in twitter streams.
ACM Transactions on Knowledge Discovery from Data (TKDD), 13(4):1–28, 2019. - 27
-
Takeshi Sakaki, Makoto Okazaki, and Yutaka Matsuo.
Earthquake shakes twitter users: real-time event detection by social sensors.
In Proceedings of the 19th international conference on World wide web, pages 851–860, 2010. - 28
-
Barbara Poblete, Jheser Guzmán, Jazmine Maldonado, and Felipe Tobar.
Robust detection of extreme events using twitter: Worldwide earthquake monitoring.
IEEE Transactions on Multimedia, 20(10):2551–2561, 2018. - 29
-
Gabriele Ranco, Darko Aleksovski, Guido Caldarelli, Miha Grčar, and Igor
Mozetič.
The effects of twitter sentiment on stock price returns.
PloS one, 10(9):e0138441, 2015. - 30
-
Eiji Aramaki, Sachiko Maskawa, and Mizuki Morita.
Twitter catches the flu: detecting influenza epidemics using twitter.
In Proceedings of the 2011 Conference on empirical methods in natural language processing, pages 1568–1576, 2011. - 31
-
Nicole E Kogan, Leonardo Clemente, Parker Liautaud, Justin Kaashoek, Nicholas B
Link, Andre T Nguyen, Fred S Lu, Peter Huybers, Bernd Resch, Clemens Havas,
et al.
An early warning approach to monitor covid-19 activity with multiple digital traces in near real time.
Science Advances, 7(10):eabd6989, 2021. - 32
-
Ryota Kobayashi and Renaud Lambiotte.
Tideh: Time-dependent hawkes process for predicting retweet dynamics.
In Tenth International AAAI Conference on Web and Social Media, 2016. - 33
-
Julia Proskurnia, Przemyslaw Grabowicz, Ryota Kobayashi, Carlos Castillo,
Philippe Cudré-Mauroux, and Karl Aberer.
Predicting the success of online petitions leveraging multidimensional time-series.
In Proceedings of the 26th International Conference on World Wide Web, pages 755–764, 2017. - 34
-
Paul Jaccard.
The distribution of the flora in the alpine zone. 1.
New phytologist, 11(2):37–50, 1912. - 35
-
Kazuhisa Makino and Takeaki Uno.
New algorithms for enumerating all maximal cliques.
In Scandinavian workshop on algorithm theory, pages 260–272. Springer, 2004. - 36
-
Jaewon Yang and Jure Leskovec.
Patterns of temporal variation in online media.
In Proceedings of the fourth ACM international conference on Web Search and Data Mining, pages 177–186, 2011. - 37
-
Japan gives first covid-19 vaccinations to tokyo health workers.
https:www.japantimes.co.jpnews20210217nationalvaccination-rollout-begins. - 38
-
Taku Kudo.
Mecab: Yet another part-of-speech and morphological analyzer.
http://mecab. sourceforge. jp, 2006. - 39
-
James MacQueen et al.
Some methods for classification and analysis of multivariate observations.
In Proceedings of the fifth Berkeley symposium on mathematical statistics and probability, volume 1, pages 281–297. Oakland, CA, USA, 1967. - 40
-
Dorin Comaniciu and Peter Meer.
Mean shift: A robust approach toward feature space analysis.
IEEE Transactions on pattern analysis and machine intelligence, 24(5):603–619, 2002. - 41
-
Joe H Ward Jr.
Hierarchical grouping to optimize an objective function.
Journal of the American statistical association, 58(301):236–244, 1963. - 42
-
Radim Řehůřek and Petr Sojka.
Software Framework for Topic Modelling with Large Corpora.
In Proceedings of the LREC 2010 Workshop on New Challenges for NLP Frameworks, pages 45–50, 2010. - 43
-
Fabian Pedregosa, Gaël Varoquaux, Alexandre Gramfort, Vincent Michel,
Bertrand Thirion, Olivier Grisel, Mathieu Blondel, Peter Prettenhofer, Ron
Weiss, Vincent Dubourg, et al.
Scikit-learn: Machine learning in python.
Journal of Machine Learning Research, 12:2825–2830, 2011. - 44
-
NYSOL Python.
https://www.nysol.jp/, 2020. - 45
-
June Leskovec.
K-spectral centroid: Cluster time series by shape.
http://snap.stanford.edu/data/ksc.html.